30 Year Average Rainfall Maps

The conclusion of the 2006 growing season completed a 30 year continuous record of precipitation during the growing season in North Dakota. This has led to the completion of average rainfall maps for each month and the growing season as a whole.

Please note that data tables for these maps are not available. However, all precipitation data can be viewed at our Precipitation Data page.

ND map of 30 year average rainfall in April. The northern half is driest at 0.54 inches. Highest precipitation is in the SE quarter of the state at 1.86 inches.
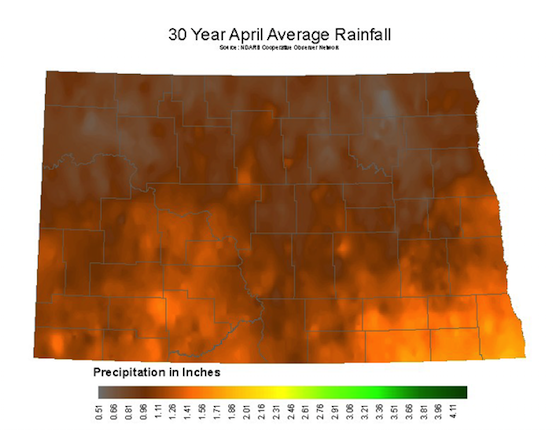
April Average Rainfall
ND map of 30 year average rainfall in May. The western half is drier than the eastern half with precipitation ranging from 1.68 to 3.33 inches.
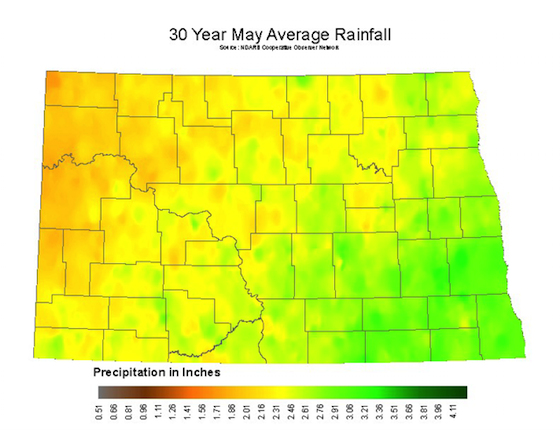
May Average Rainfall
ND map of 30 year average rainfall in June. The western half is drier than the eastern half with precipitation ranging from 2.63 to 4.12 inches.
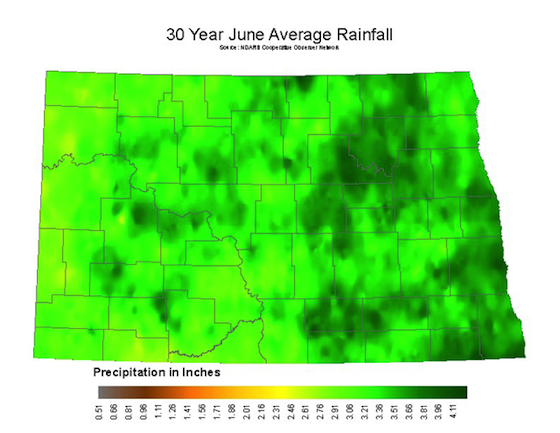
June Average Rainfall
ND map of 30 year average rainfall in July. The southwestern quarter is drier than the eastern half with precipitation ranging from 1.8 to 4.05 inches.
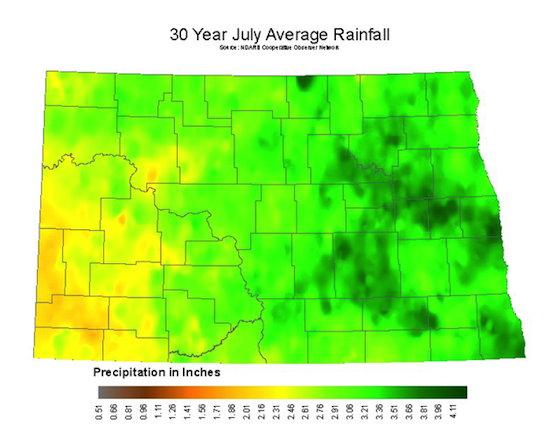
July Average Rainfall
ND map of 30 year average rainfall in August. The western half is drier, with the northeastern quarter being the wettest. Precipitation ranges from 1.19 to 3.37 inches.
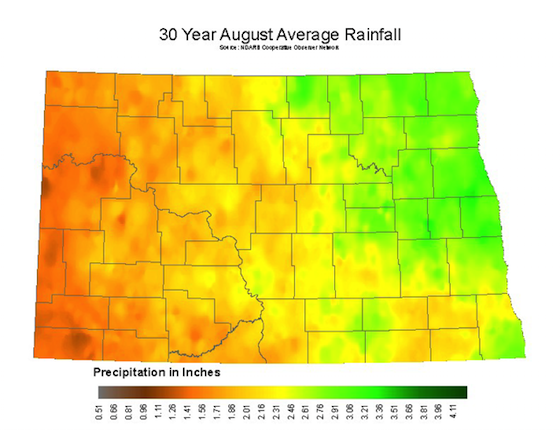
August Average Rainfall
ND map of 30 year average rainfall in September.The western half is drier, with the southeastern quarter being the wettest. Precipitation ranges from 1.06 to 2.67 inches.
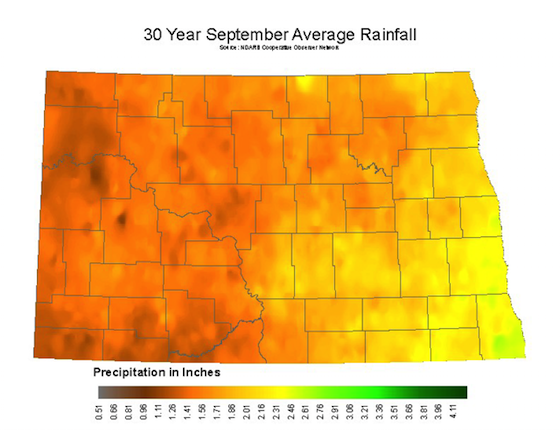
September Average Rainfall
ND map of 30 year average seasonal rainfall. Precipitation ranges from 10.08 to 17.87 inches.
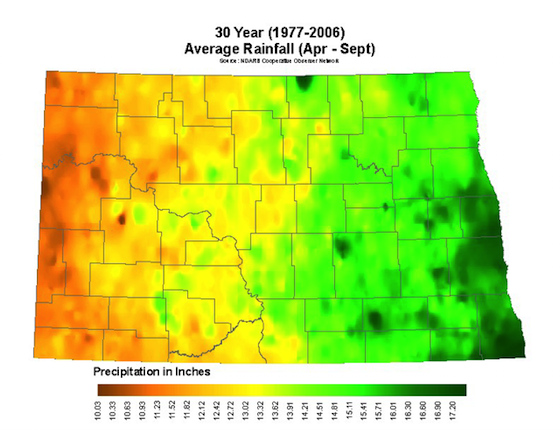
Seasonal Average Rainfall